Generating psychometric testing reports
ClientDovetail Partners
Scaling presents particular challenges for growing businesses. Dovetail Partners provide leadership development and coaching, and had grown to the point where manually processing tests and creating reports was no longer feasible. Following a recommendation they approached me to see what could be done.
The problem
The partners needed to focus on growing their new business, but everyone was working flat out. The analysis was run via Excel spreadsheets, and inputting and outputting data was a bottleneck. As a high-touch, high-value service the founders were keen to automate as much as possible rather than add staff.
The solution
Dovetail Partners needed an upgraded administration system. I created an internal management application to replace Microsoft Excel that allowed the partners to do the arduous tasks in a fraction of the time. Customer responses were collected online rather than via email, and non-responders could be automatically followed up. Graphical reports were generated at the click of a button.
Before being built the system was prototyped and tested on customers to ensure it was easy to use.
Results
The new system liberated the partners to concentrate on profit making activities, like winning more clients.
Customers liked that they can complete the psychometric questionnaire on the go on their mobiles, and didn’t need to have a copy of Microsoft Excel installed on their computer.
Dovetail Partners has continued to grow, and the administration system is a cornerstone of their business.
If you need your business systems to get out of your way, call me (Peter Bowyer) now on 023 80018 604 or book your free 20 minute consultation online.
Geeking out
From a technical point of view, this project contained unique challenges not normally found in line-of-business software applications.
The project split down into 3 sections:
- Reverse-engineer an organically developed Excel spreadsheet containing the algorithm, and re-implement in code.
- Create the charts and PDF reports
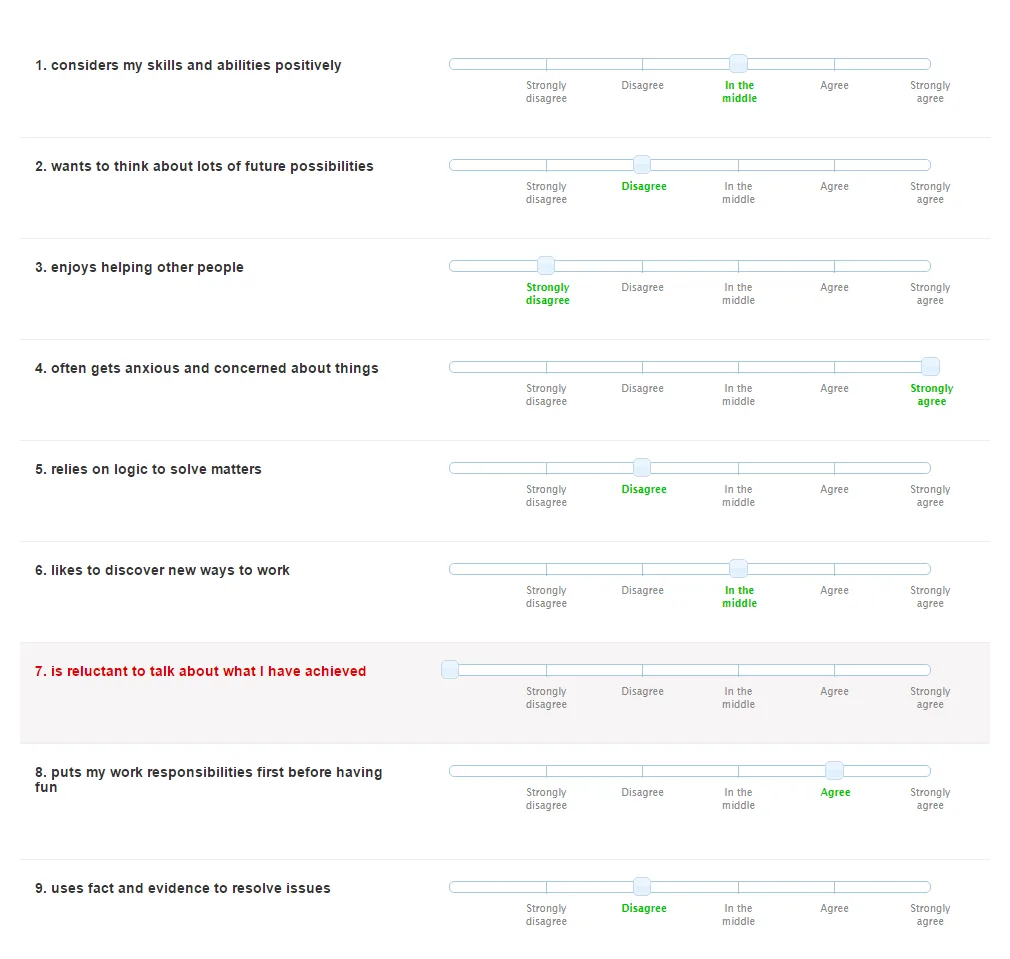
- Provide an easy-to-use web interface to collect data and process results
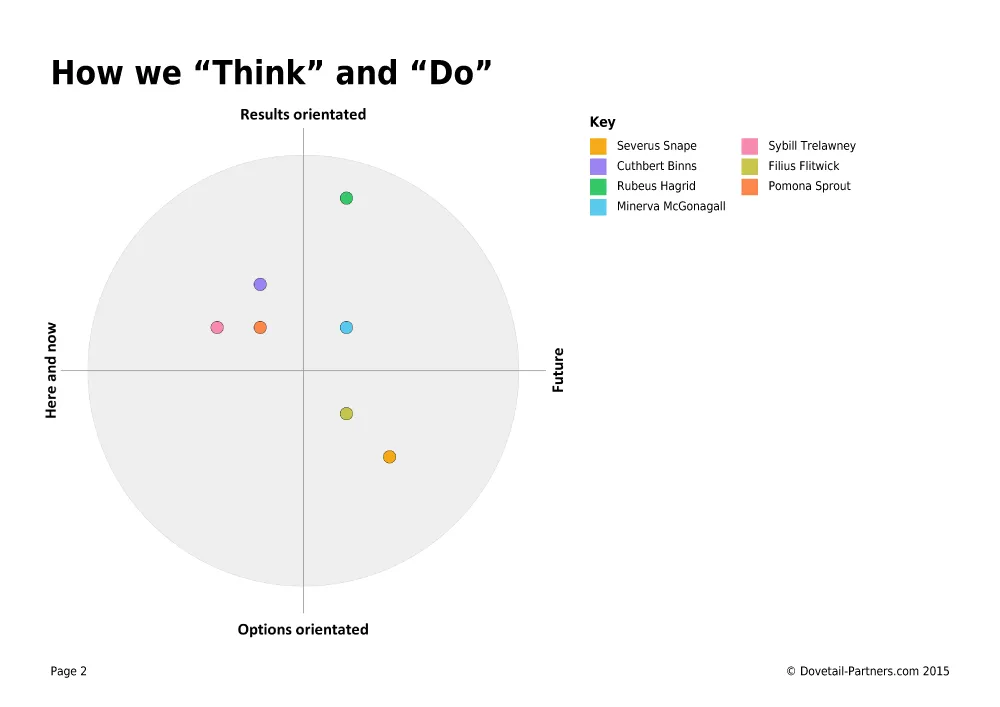
Creating the charts
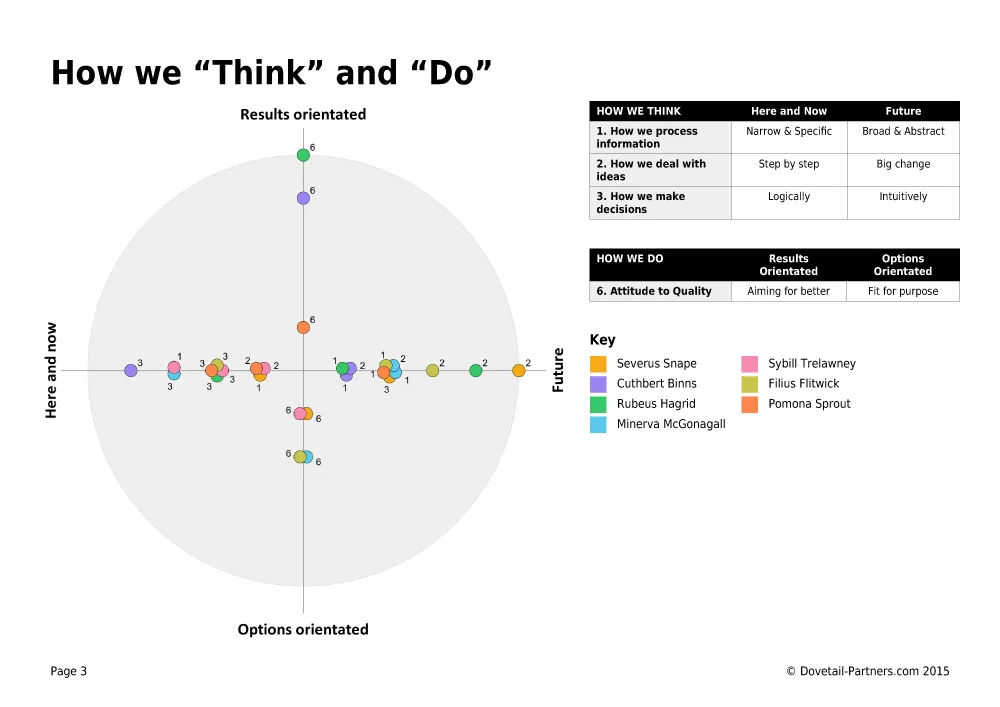
The most enjoyable part of the project for me was devising an algorithm for plotting the diagrams in the reports. Because of the nature of the visualisations, values are discrete. When doing team reports, identical values can’t be plotted on top of each other, and must be legible so we can identify which members had that score.
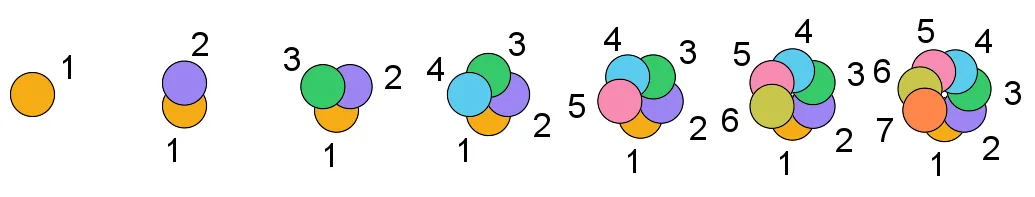
I started with a simple approach of jiggling the points so they could be seen. It quickly became apparent that the amount they needed to move was not linear as the number increased. For best results I had to devise a formula through trial and error, and have it scale.
This was complicated by the labels for each point needing to not overlap – with each other or with neighbouring points. The positioning of these – and how they moved as the points jiggled – became an exercise in itself, and I used recent academic papers as inspiration, while simplifying their methods.
The results are very satisfactory and clearly show overlaps between people.
Results
- 90% reductionin admin time
- No staffneed to be hired
- Free Timecreated to grow the business
results for you.
We've worked for organisations on 6 of the world's 7 continents (Antarctica has proved elusive). You next?